In this tutorial we’re going to learn how to Troubleshoot Performance Issues with the CPU, RAM, disc I/O, network usage, and general responsiveness of the system. You can use the following popular Linux commands and utilities to troubleshoot performance issues:
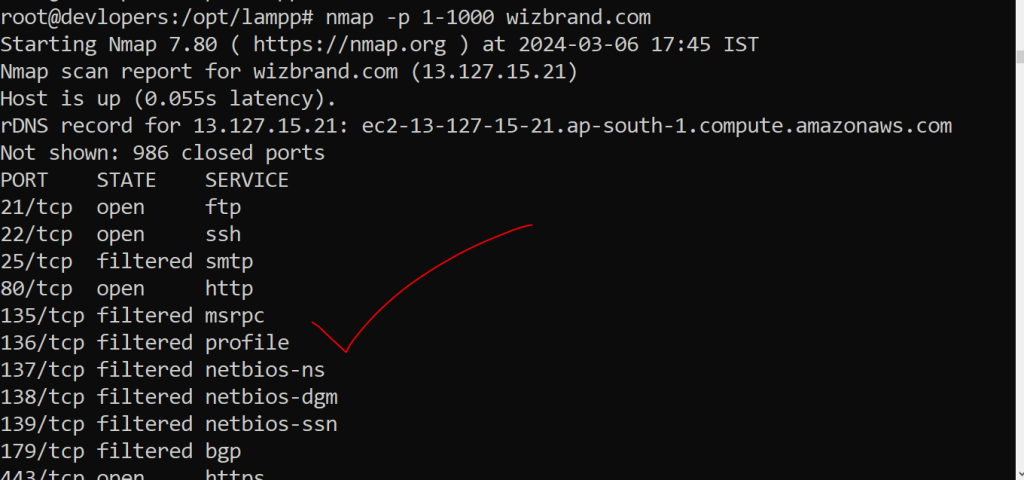
1 nmap Command:
Network exploration tool and security scanner.
nmap -p 1-1000 wizbrand.comOutput:-
2. sar (System Activity Reporter):
In Unix-like operating systems, the command-line utility sar, or System Activity Reporter, gathers, reports, and saves system activity data. It is used to track system performance data and is a component of the sysstat package. Real-time data on CPU load, memory paging, swap utilisation, network I/O, and other topics are available from Sar. Additionally, it can show historical data for particular time periods, enabling examination of previous performance problems.
After installation, sar allows you to view historical data from log files or real-time statistics. For instance, you only need to run sar into the terminal to see the CPU load for the current day. The command sar interval iterations, where interval is the number of seconds between snapshots and iterations is the number of times to produce the statistics, can be used to display real-time statistics.
The following are some typical sar command options:
-A: All statistics-b: I/O statistics-B: Swap usage statistics-d: I/O for each block device-n ALL: All network statistics-q: Processor queue (cache) statistics-r: Memory and swap statistics-u: CPU statistics (default)-v: Kernel statistics-W: Simplified swap statistics
3. iostat
Linux users can obtain CPU and input/output statistics for devices and partitions using the iostat command-line utility. Its purpose is to track the loading of system input/output devices by measuring the duration of each device’s operation in comparison to its typical transfer rate.
Here are some common uses of iostat with examples:
- Basic usage: Running
iostatwithout any arguments will display CPU and device statistics since the last reboot. - Detailed statistics: Using the
-xoption will show more detailed statistics information.
iostat -x
- CPU statistics only: To display only CPU statistics, use the
-coption.
iostat -c
- Device statistics only: The
-doption will display only the device report.
iostat -d
- Extended I/O statistics for devices: The
-xdoption shows extended I/O statistics for devices only.
iostat -xd
- Statistics in kilobytes or megabytes: The
-koption captures the statistics in kilobytes, and-mcaptures them in megabytes.
iostat -k
iostat -m
- Repetition and delay: You can set a count (the number of times to update) and a delay (the interval between updates). For instance, running iostat -k 2 3 will produce 3 reports and show CPU and device data with a 2-second lag between each report.
iostat -k 2 3
- Persistent device name statistics: The
-joption allows you to display persistent device name statistics.
iostat -j ID mmcbkl0 sda6 -x -m 2 2
- Statistics for block devices: The
-poption displays statistics for block devices.
iostat -p
- LVM2 statistic information: The
-Noption displays LVM2 statistic information.
iostat -N4. ifconfig Command
Displays or configures network interfaces.
Example :-
ifconfig5. ip Command
Provides extensive networking information.
Example :-
ip addr show
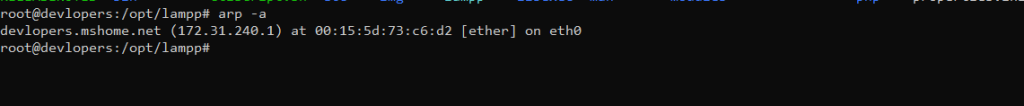
6. arp Command
Displays the ARP cache.
Example :-
arp -a
Output:-
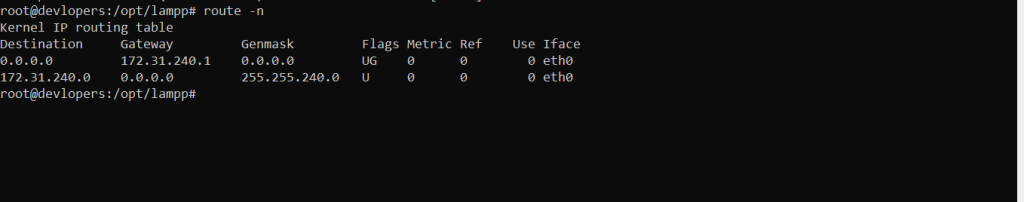
7. route Command
Displays and manipulates the IP routing table.
Example :-
route -n
Output :-
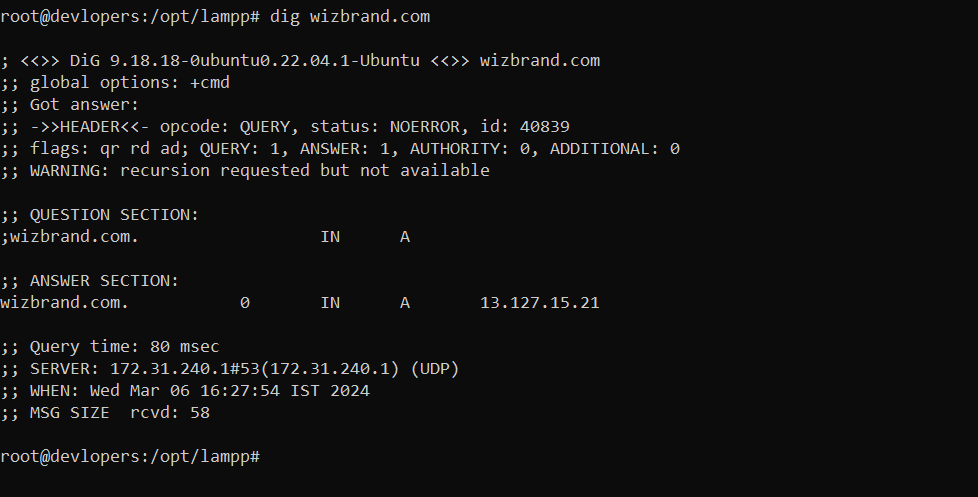
8. dig Command
Performs DNS lookup and displays the response.
Example :-
dig wizbrand.com
Output:-
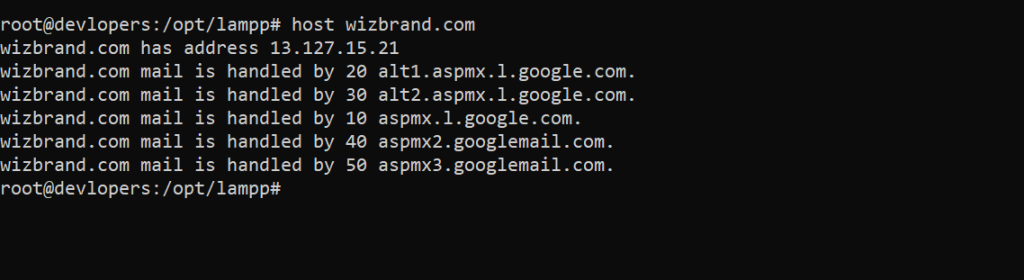
9. host Command
Performs DNS lookup and displays the response.
Example :-
host wizbrand.comOutput:-
10. uptime Command:
Displays system uptime and load average.
Example :-
uptime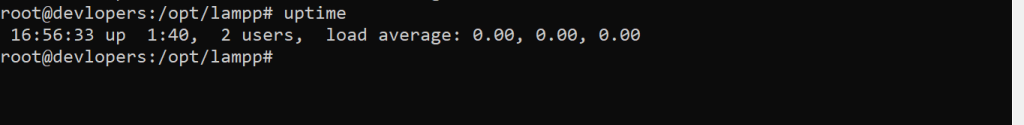
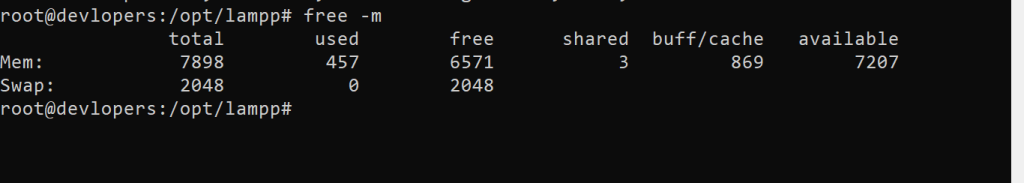
11. free Command
Displays free and used memory in the system.
free -m
Output:-
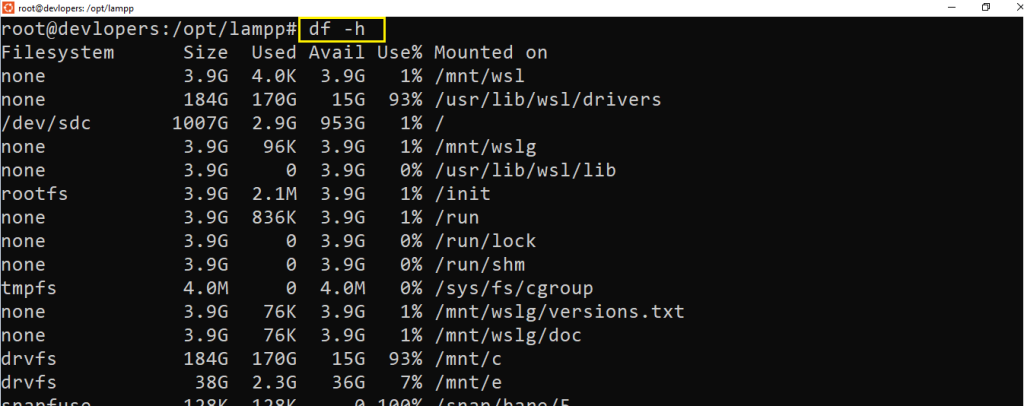
12 df Command
Displays disk space usage.
Example :-
df -h
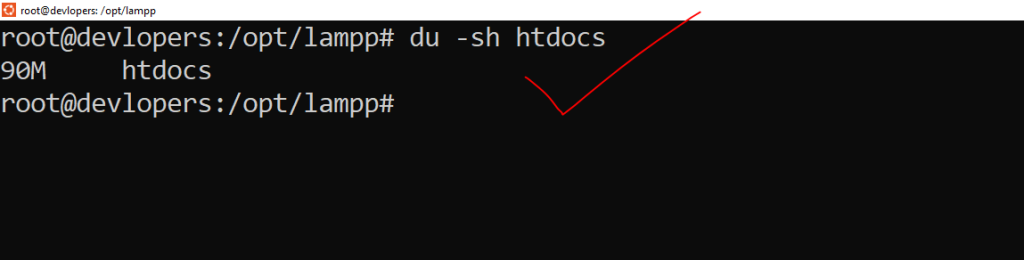
13 du Command
Displays disk usage of files and directories.
Example :-
du -sh htdocsOutput:-
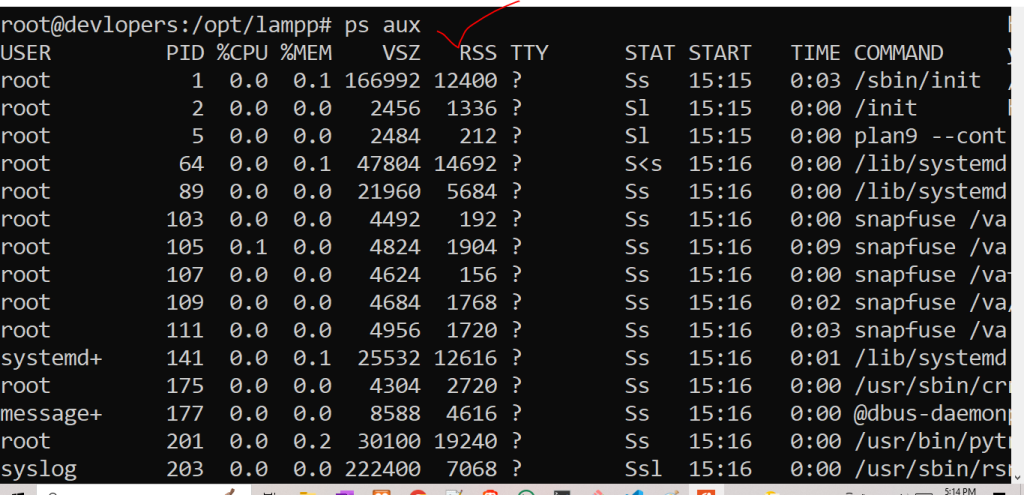
14. ps Command
Displays a snapshot of current processes.
Example:-
ps auxOutput:-
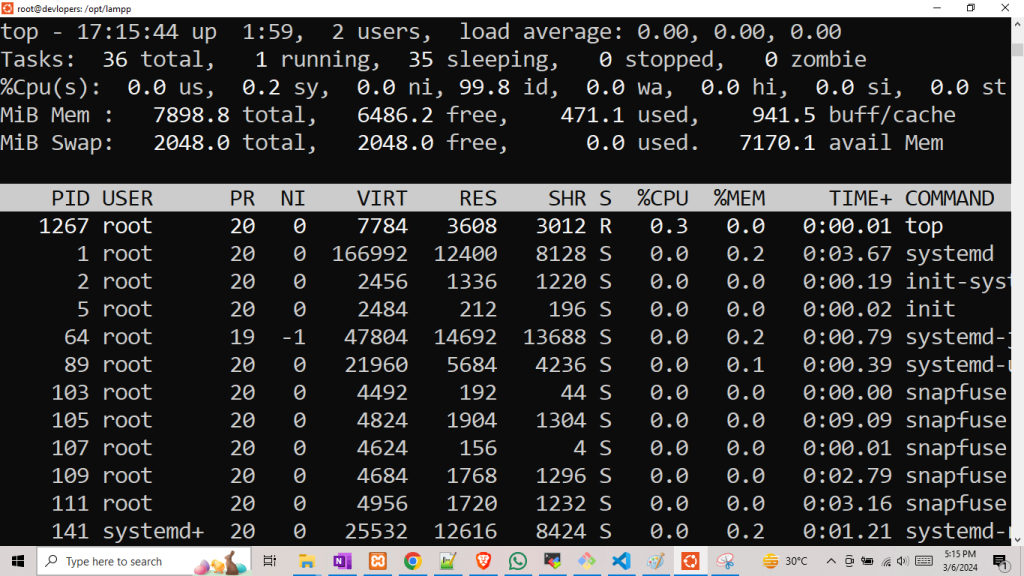
15. top Command
Displays real-time information about system processes and resource usage.
Example:-
top
Output:-
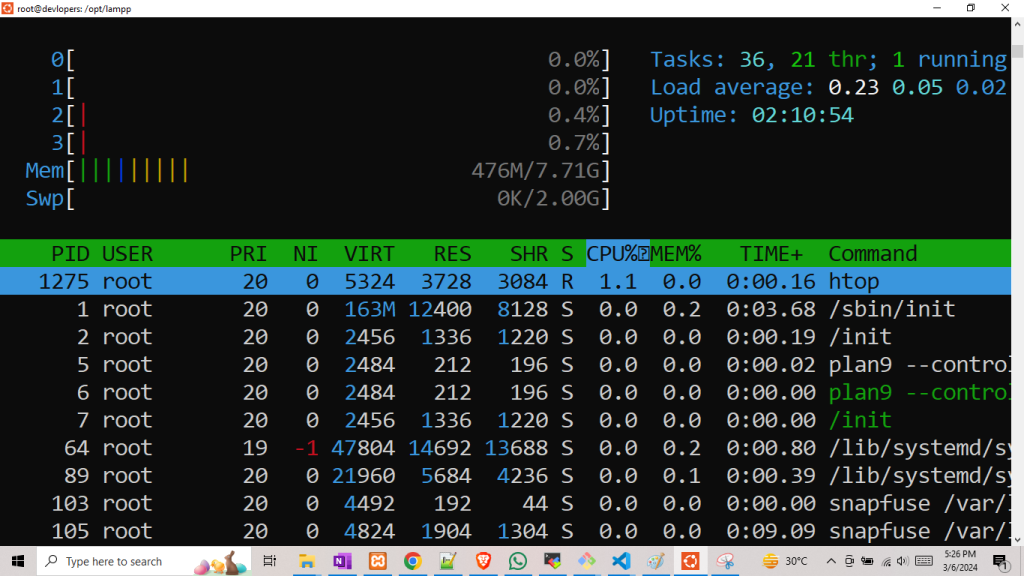
16 htop Command:
Interactive process viewer.
Example :-
htop
Output:-
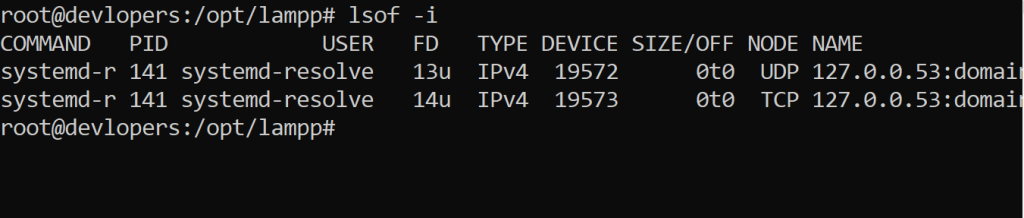
17. lsof Command
Lists open files and the processes that opened them.
lsofOutput:-
18. strace Command
Traces system calls and signals.
strace -p PID
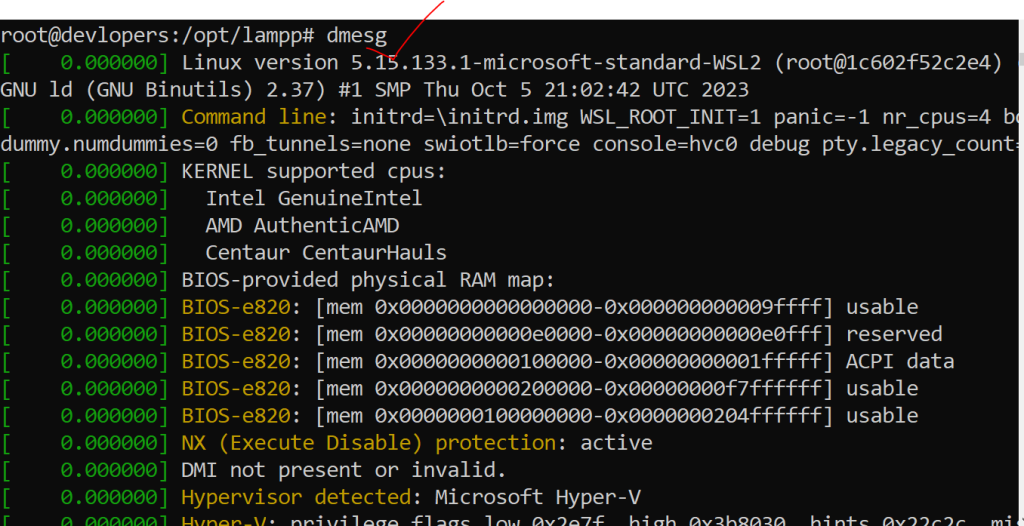
19. dmesg Command
Displays kernel ring buffer messages
dmesgOutput:-
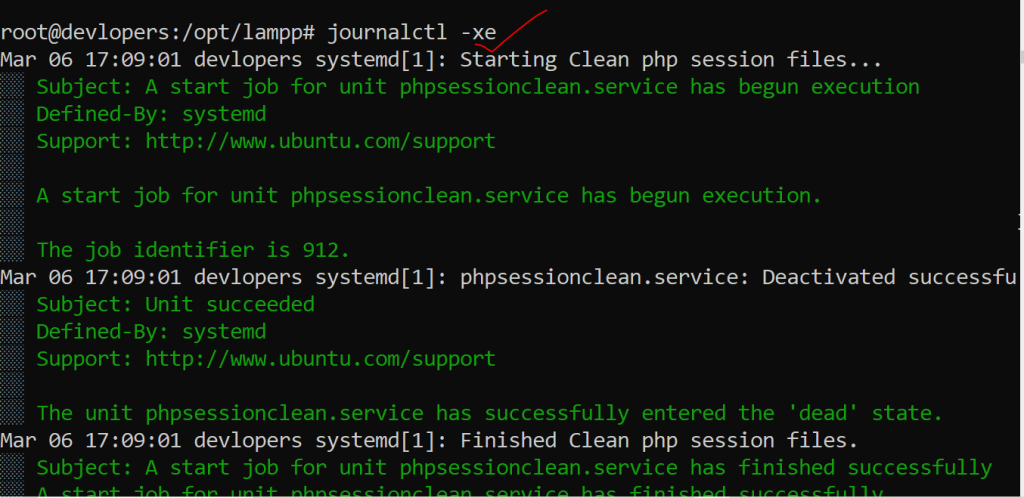
20. journalctl Command
Views system logs (systemd).
Example:-
journalctl -xe
Output:-
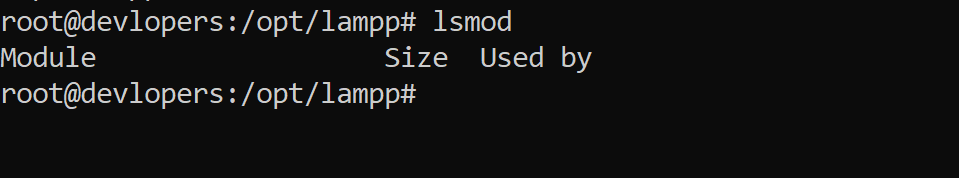
21. lsmod Command
Lists loaded kernel modules
Example:-
lsmod
Output:-
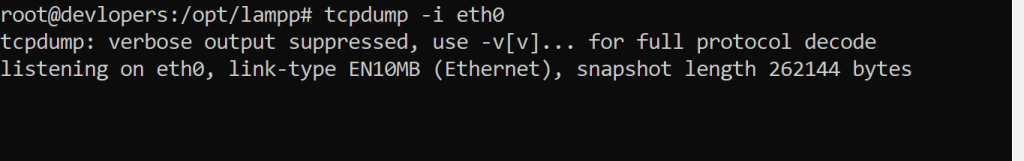
22. tcpdump Command
Captures and displays network packets.
Example:-
tcpdump -i eth0
Output:-
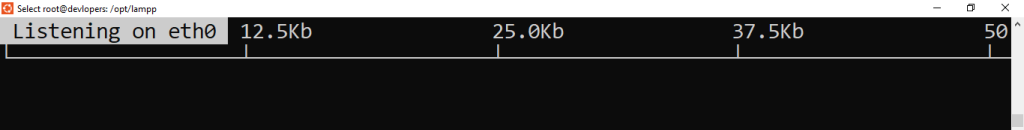
23. iftop Command
Displays bandwidth usage on an interface.
Example:-
iftop -i eth0
Output:-
Thanks for reading.👍👍